Introduction
This post is the first of a three-part series demonstrating how to use Voilà to deploy your Jupyter notebook analysis as a web application
Interested in creating a Python dashboard to bring your analysis to life for non-technical stakeholders? Which technology should you use - Streamlit, Dash? How much of your analysis do you need to refactor in order to turn it into an application?
The answer might be none.
It is possible to turn your Jupyter notebook analysis straight into a functioning interactive Python dashboard in one click using Voilà . No code refactoring or custom library syntax required.
Jupyter notebooks are ubiquitous in the world of data science. They are simple to use with a low barrier to entry, very flexible and an excellent tool for presenting graphs inline with descriptive annotations with markdown. Almost all Data Science projects will involve a Jupyter notebook at some point along the way, typically at the exploratory data analysis phase of the project.
However, a common pain point for data scientists is sharing your inciteful analysis with colleagues and non-technical stakeholders.
Directly showing your Jupyter notebook to non-technical stakeholders can be confusing. The large code blocks and unfamiliar interface provide a distraction to the key insights presented in your notebook.
Wouldn’t it be great if you could strip out code blocks and present the key findings of your notebook as an interactive dashboard at the click of a button?
Enter Voilà!
What is Voilà?
“Voilà allows you to convert a Jupyter Notebook into an interactive dashboard that allows you to share your work with others. It is secure and customizable, giving you control over what your readers experience." Voilà Documentation
Voilà is part of the Jupyter ecosystem of open-source projects. It is compatible with other Jupyter projects such as ipywidgets and nbconvert templates
It is a library which is used to directly convert your Jupyter notebooks (.ipynb files) into stand-alone interactive web-based dashboard applications.
Interactivity is primarily achieved through the use of ipywidgets. If your notebook already utilises ipywidgets for users to change parameters and callbacks to update your graphs, this interactivity will pass directly to the web application version of your notebook.
Alternatives
There are a number of popular alternatives to Voilà such as Dash , Panel and Streamlit
In certain circumstances, these may be a more appropriate option. Out of the box, your Voilà application won’t look as beautiful as a Streamlit application and it can be more complicated to customise your application CSS and layout than a Dash application.
However, the strength of Voilà is that you don’t need to use any Voilà specific code. Any Jupyter notebook will instantly be converted into a webapp. If you have used ipywidgets in your notebook you will have an interactive web application in one click. You can see why it was named Voilà!
Example Dashboard Application
For this demonstration I have created a relatively simple notebook which compares the stock price performance of a select group of popular tech stocks. The application is coded inside a notebook and utilises ipywidgets to enable interactivity and allow the user to specify different input parameters.
💻 The code is available in this GitHub repo . Follow the instructions in the README.md to follow along!
The user can select multiple stocks and a time period for comparison and the application will plot the stock price performance and calculate various metrics useful for comparison. For example, total return, drawdown periods and correlations between the selected stocks.
Explaining the code is beyond the scope of this post – after all, it is just a normal Jupyter notebook. The example is created to demonstrate what I believe is a realistic scenario where you have coded an interactive application for your own analysis and you now want to share and present it with other colleagues and stakeholders with minimal effort.
Installing Voilà
Voilà can be installed from PyPI or conda-forge
# from pypi
pip install voila==0.3.0a2

# from conda-forge
conda install -c conda-forge voila==0.3.0a2
Note: it is important to use a voila version which is greater than 0.3.0 as will be explained in part 2 and 3 when we investigate performance optimisation and deployment
One click deployment
Once Voilà is installed you will notice a new Voilà icon in the Jupyter notebook/lab toolbar.
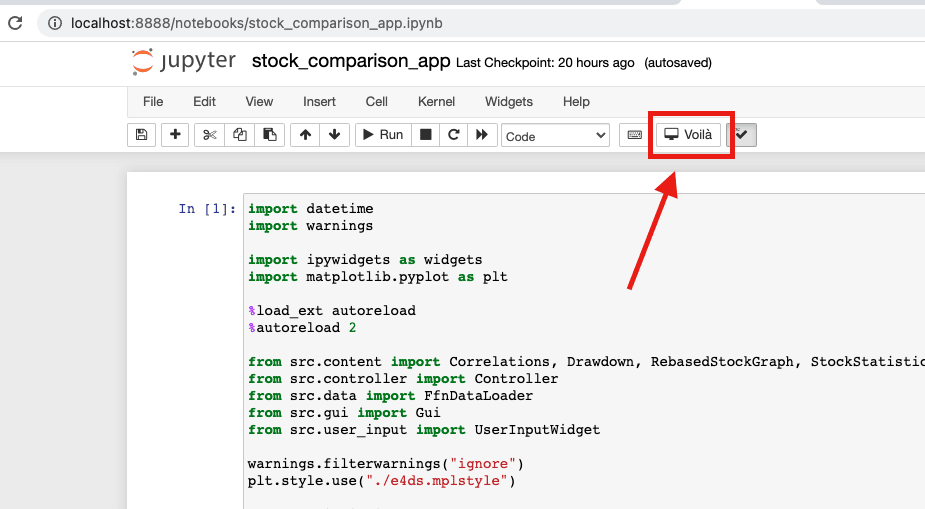
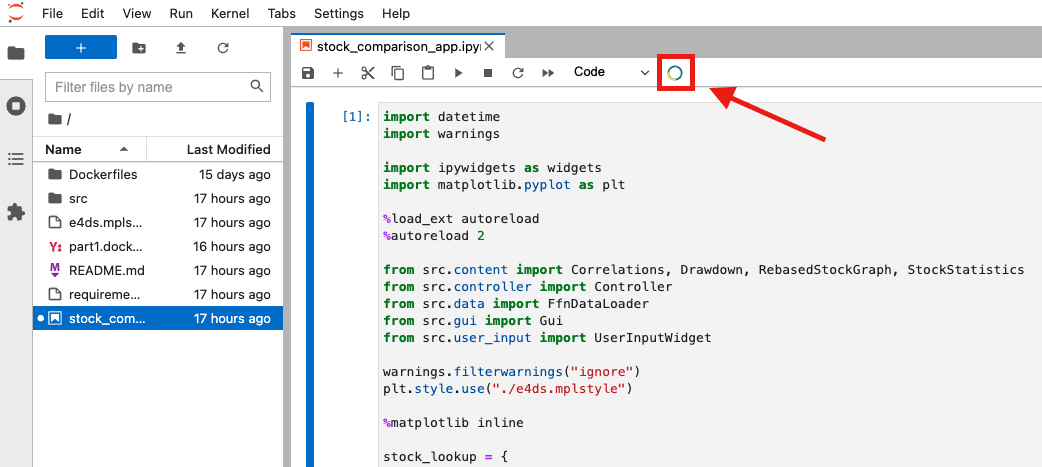
Simply click on this button and Voilà will automatically convert your notebook into a web application
Launch from the command line
Alternatively, you can launch your application from the command line and specify various configuration options
# launch from command line
voila stock_comparison_app.ipynb
For example running in debug mode you can add the --debug flag which can be useful for diagnosing errors or performance issues
# launch with debug mode activated
voila stock_comparison_app.ipynb --debug
Conclusion
There we go! How to convert your Jupyter notebook analysis into an interactive dashboard in one click.
I have been very impressed with Voilà while working with it on a project over the last few weeks. While it may not have all the hype of other dashboarding tools such as Streamlit or Dash, Voilà really holds its own.
Voilà’s power is in its simplicity. No refactoring of your notebook required and no custom scripting libraries or syntax. For a basic application, you can get started with just a click of the notebook extension.
I see Voilà as an ideal solution for quickly stripping out code cells from your notebook allowing you to focus on the analysis outputs from your notebook when presenting to stakeholders in a meeting.
Voilà is also great for demonstrating a quick proof of concept web application when you want to get your analysis out to others in your organisation.
However, Voilà isn’t just for proof of concepts. Voilà scales very well. Organisations are already using it in production to serve customer facing web applications. With some modifications to the HTML templates you can apply your own company branding for a professional look. Imagine empowering your business analysts to be able to publish their analysis as web applications straight from a Jupyter notebook which can be directly consumed by customers or internal stakeholders. Pretty cool!
In the following two posts in this series, I want to focus more on how you could put your notebook applications into production. The next post , will demonstrate how to configure Voilà to improve performance for (almost) instantaneous loading for your users 🚀
See you in the next one!
💻 The code for the example Python dashboard is available in this GitHub repo .
Further Reading
- Voilà! Optimising Python Dashboard Performance (Part 2)
- How to extract bucket and file name from a Google Cloud Storage URI
- How to set up an amazing terminal for data science with oh-my-zsh plugins
- Data Science Setup on MacOS
- Matplotlib: Plotting Subplots in a loop
- Google Cloud Professional Cloud Architect Exam Notes (July 2021)
- Top 10 Technical Resources for Google Cloud
- Algorithms to Live By (Book Notes)
- Sapiens (Book Notes)